
Blog
Administrative Professionals week is time to celebrate the very real contribution administrators make to kiwi business and community organisations. Who are the people who take the lion’s share of responsibility for administration in kiwi organisations?
This deep dive into the Annual Household Labour Force Survey 2016 paints a demographic picture of people in clerical or administrative roles in New Zealand – aka administrators. If diving deeply into statistics isn’t your thing just skip to the last section, absorbing the headlines as you go.
One in five working women in New Zealand are administrators
Thirteen percent of New Zealand’s total workforce and almost one-fifth of working women (19%) are administrators, making administration the second largest occupational category among kiwi women.
Few of our men work as administrators. While one in five working women are administrators, just 5% of working males have administration roles. The same proportion are community and personal service workers, and these two categories tie for last place in terms of the number of kiwi males in an occupational group.
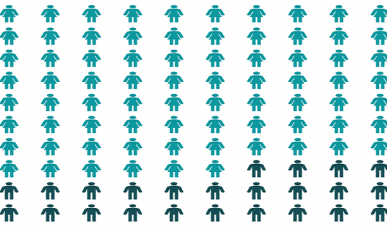
Drill down into the administration community and you find that just over three-quarters (76%) of New Zealand’s administrators are women, making it the country’s most female dominated occupational group. To put this in perspective, the occupational group with the next highest proportion of women are the community and personal service workers at 69% female.
For the record, administration is not the biggest occupational group for kiwi women. There are more women in the ‘professional’ category. Thirty percent of kiwi woman are professionals, but that group is not female dominated. There are a fairly even number of male and female professionals.
Slightly older than the workforce in general
The age profile of the administration community is skewed toward those aged forty-five or older. While two-fifths (59%) of the total New Zealand workforce are under forty-five, only half of our administrators (51%) are in this category. Like with many occupations today, administrative careers do not necessarily end on your 65th birthday. Five percent of the workforce and 6 percent of administrators are aged 65 or over.
Ethnically diverse
Administrators in New Zealand are almost as ethnically diverse as the working population itself. Europeans are slightly over-represented among the administration community – 68% of the workforce and 71% of administrators describe themselves as European. This is off-set by a slight under-representation of Maori (12% of workforce, 10% of administrators) and Pacific Peoples (6% of workforce, 5% of administrators). The number of administrators who are Asian (12%) or other ethnicities (2%) is in direct proportion to the ethnicity profile of the working population.
Increasingly well qualified
Half (52%) of kiwi administrators have post-secondary school qualifications, 17% have a diploma or a certificate up to level 6, one-fifth (21%) have a bachelor’s degree or level 7 certificate and some have a post graduate qualification (7%) or another kind of post-secondary school qualification (8%). The education level of New Zealand’s administrators is increasing, with a 4% increase in the proportion of administrators with bachelor’s degrees between 2013 and 2016.
While education levels are on the rise in the administration community, the proportion with a post-school certificate or diploma (17%) is still a little lower than the proportion in the total workforce (20%). The proportion with a bachelor’s degree or level 7 qualification is almost the same (22% of total workforce, 21% of administrators) and the proportion with a masters dress is lower (10% of total workforce, 7% of administrators).
Median income earners
The median hourly earnings for administrators matches the national median hourly earnings at $23.49 per hour. The gender related earnings gap is lower for the sector than the national average. The median hourly income for kiwi women is 12% below that of kiwi men, but the median hourly income for women in New Zealand’s administrative sector is ‘only’ 8% lower than that of their male colleagues. You can draw your own conclusions about the relationship between the earnings gap and the lack of males in administrative occupations.
A room full of kiwi administrators
If you gathered 100 people in a room to accurately represent the demographic profile of our workforce and 100 in another room to represent the administration community in New Zealand, there would be:
- 49 women in the total workforce room and 76 in the administrators’ room.
- 8 more people aged 45 or over in the administrators’ room.
- 3 more Europeans, 2 less Maori and one less Pacifica person in the administrators' room.
- 7 fewer people with post-secondary school qualifications in the administrators' room.
If the people in each room were lined up according to their hourly earnings, the one in the middle of each group would have the same hourly earnings as the one in the middle of the other group.
This article was produced for Booking Rooster and Events Pronto by Moira Moroney and Chris Winslade. Moira is one of the company founders and Chris is National Accounts Manager. Together they have over 50 years of marketing and customer engagement experience. Find out more about their achievements in New Zealand and Internationally across corporate, SME and entreprenuerial enterprises by clicking on their names to see their LinkedIn profiles.
